The Inequity Z: Income Fairness Perceptions in Europe Across the Income Distribution
New Socius publication
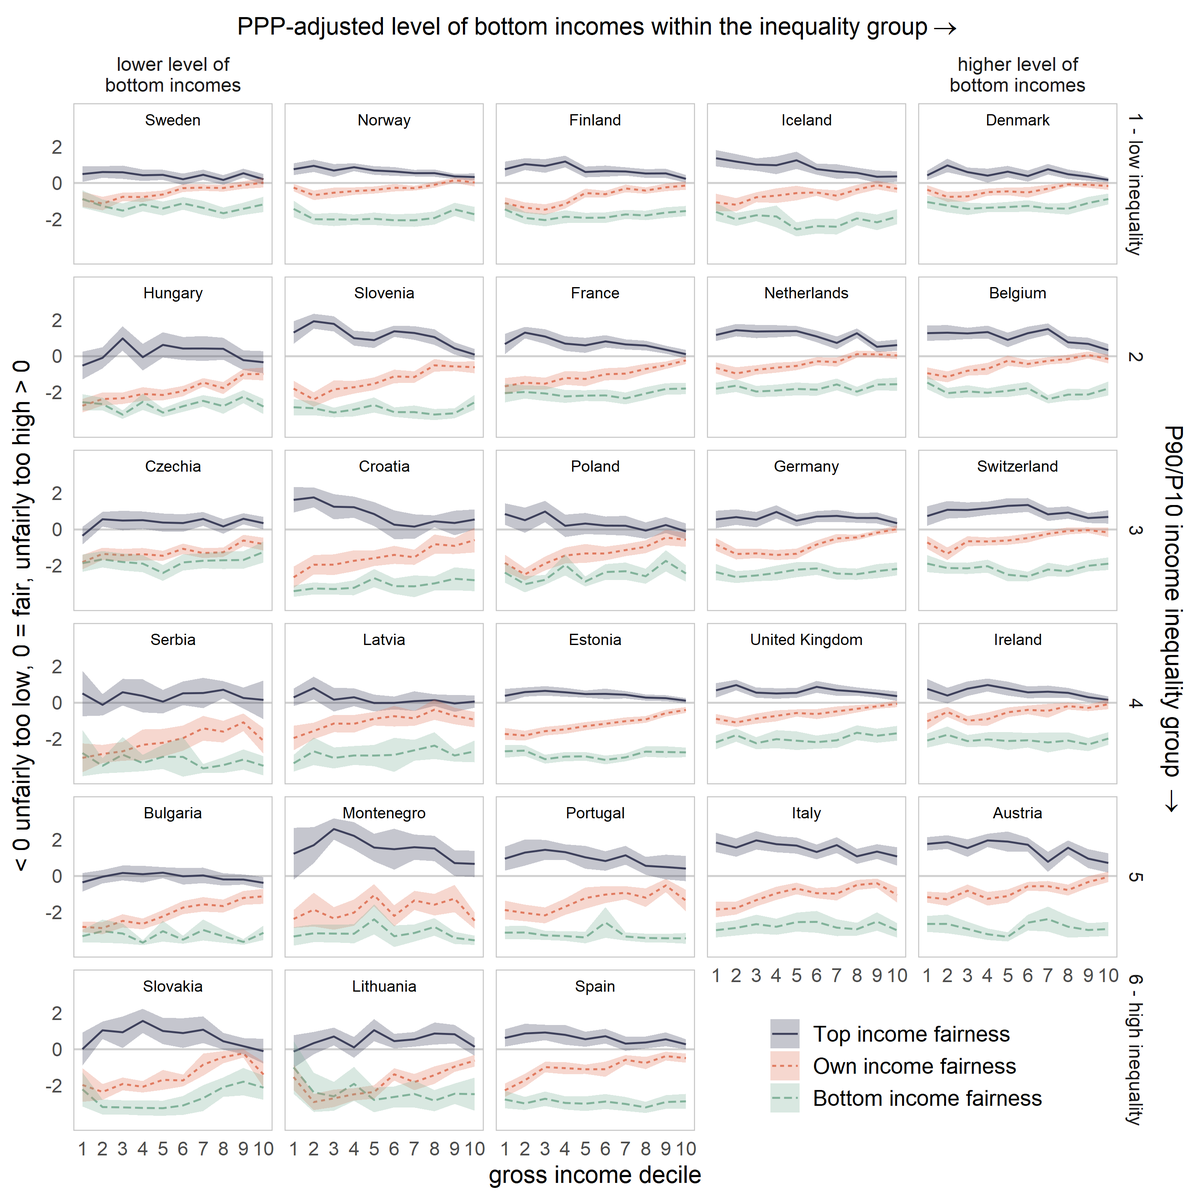 Average fairness evaluation of own gross income (red), the lower bound of the top gross income decile (black), and the upper bound of the bottom income decile (green) by country and respondents’ income position. Data source: European Social Survey Round 9
Abstract
Using data from the European Social Survey, this visualization examines income fairness evaluations of 17,605 respondents from 28 countries. Respondents evaluated the fairness of their own income as well as the fairness of the income of the top and bottom income decile in their country. Depicted on a single graph, these income fairness evaluations take on a Z-shaped form, which we call the “inequity Z”. The inequity Z reveals an extensive level of consensus within each country regarding the degree of unfairness of top and bottom incomes. With rising income, respondents consistently judge their own income to be less unfair. Across countries, the gap in fairness ratings between top and bottom incomes rises with income inequality. Perceived underreward of bottom incomes is more pronounced in countries where bottom incomes are objectively lower. Thus, our visualization suggests, when confronted with information about actual income levels, perceived inequity increases with inequality.
Full Text
The original full text including the supplementary appendix can be accessed here Link the publication can be found @ SOCIUS.
Fabian Kalleitner
Postdoctoral Researcher
My research interests include tax preferences, biased perceptions, fairness attitudes, and work values. To gather insights in these topics I combine theories and insights of sociology, economics, and psychology using various methodological approaches (i.e. panel surveys, multilevel analyses, survey/field/laboratory experiments) and estimation strategies.